All products
Data Analytics
Toolbox Web
Open in MixpanelActive users (last 30 days)
338
+59% vs previous 30 days
Pages measured
12 of 13
Dealership and Ikon Employee views
Key tasks measured
5 of 12
Pages with a success event
Tracking plan coverage
17%
35 of 207 planned events arrive
Needs attention
HEART by page
HealthyWatchPoor
| page | HHappiness | EEngagement | AAdoption | RRetention | TTask success |
|---|---|---|---|---|---|
| Dealership view | |||||
| 6.3, Poor | 1.5 | 34% | — | 16%, Poor | |
| 3.2, Poor | 11 | 16% | 66%, Healthy | — | |
| 0.7, Healthy | 94 | 63% | 61%, Healthy | 61%, Poor | |
| 0.7, Healthy | 46 | 13% | 74%, Healthy | 95%, Healthy | |
| 2.5, Watch | 24 | 13% | 66%, Healthy | — | |
| 3.0, Poor | 37 | 9% | 71%, Healthy | 44%, Poor | |
| 0.4, Healthy | 66 | 13% | 52%, Healthy | 100%, Healthy | |
| 0.8, Healthy | 28 | 10% | 47%, Watch | — | |
| Ikon Employee View | |||||
| 1.0, Healthy | 29 | 9% | 62%, Healthy | — | |
| 0.6, Healthy | 20 | 5% | 27%, Poor | — | |
| 0.0, Healthy | 15 | 4% | 40%, Watch | — | |
| 3.7, Poor | 41 | 13% | 63%, Healthy | — | |
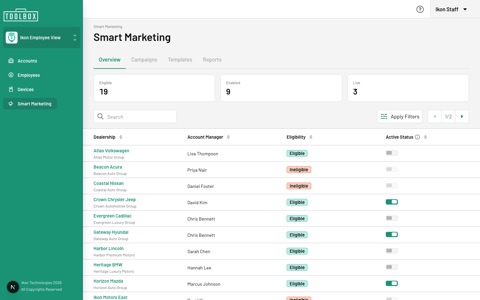 Smart MarketingNot live yet | No data until it launches in production. | ||||
How it’s measured
- Happiness
- Rage clicks per 100 page views. There’s no survey yet, so frustration stands in.
- Engagement
- Page views per user in the last 30 days.
- Adoption
- Share of Toolbox Web’s active users who used the page in the last 30 days.
- Retention
- Users who came back to the page the week after their first use, averaged over 8 weekly cohorts.
- Task success
- The page’s key task: successes out of successes and errors.
From Mixpanel project NXTG Toolbox Web PROD, Oct 7 to Nov 6. Pages are matched by URL; events by the tracking plan’s names. Anything with fewer than 10 users gets no status.
Tracking plan rules
- All CTA should have an event tied to it
- Need to know if CTA was successful/unsuccessful
- All CTA should give response in 3 seconds
- All pages should load in 3 seconds
- Need to track the type of user (roles)