All products
Data Analytics
Toolbox Mobile
Open in MixpanelActive users (last 30 days)
229
+139% vs previous 30 days
Features measured
3 of 5
The rest send no events yet
Key tasks measured
3 of 3
Features with a success event
Tracking plan coverage
42%
14 of 33 planned events arrive
Needs attention
HEART by feature
HealthyWatchPoor
| feature | HHappiness | EEngagement | AAdoption | RRetention | TTask success |
|---|---|---|---|---|---|
| 4.6, Watch | 696 | 22% | 57%, Healthy | 96%, Healthy | |
| 0.4, Healthy | 12 | 63% | 55%, Healthy | 95%, Healthy | |
| 9.7, Poor | 335 | 77% | 63%, Healthy | 90%, Healthy | |
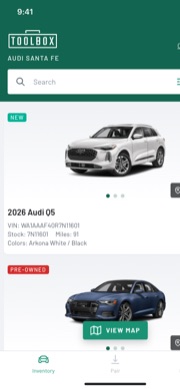 InventoryNot tracked yet | No events reach Mixpanel yet; the tracking plan lists 6. | ||||
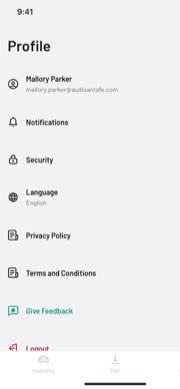 ProfileNot tracked yet | No events reach Mixpanel yet; the tracking plan lists 4. | ||||
How it’s measured
- Happiness
- Errors and cancels per 100 of the feature’s events. There’s no survey yet, so friction stands in.
- Engagement
- The feature’s events per user in the last 30 days.
- Adoption
- Share of Toolbox Mobile’s active users who used the feature in the last 30 days.
- Retention
- Users who came back to the feature the week after their first use, averaged over 8 weekly cohorts.
- Task success
- The feature’s key task: successes out of successes and errors.
From Mixpanel project NXTG Toolbox PROD, Oct 7 to Nov 6. Each feature is the events whose names start with its prefix; plan names match regardless of spacing and the “(Mobile)” suffix. Anything with fewer than 10 users gets no status.
Tracking plan rules
- All CTA should have an event tied to it
- Need to know if CTA was successful/unsuccessful
- All CTA should give response in 3 seconds
- All pages should load in 3 seconds
- Need to track the type of user (roles)